Data-Driven Insights
Powerful analytics dashboard that transforms your exam and user data into actionable insights. Track performance, identify trends, and make informed decisions.
Two Powerful Report Views
Comprehensive analytics for users and exams, all in one platform
User Reports
Track user activity, engagement, and performance metrics in real-time. Get comprehensive insights into your user base with detailed analytics.
- Monitor total users, new sign-ups, and active learners over time
- Track pass rates, average scores, and completed quizzes per user
- Visualize activity trends and top performers with bar and line charts
- Drill into individual user history to review each exam attempt


Exam Reports
Analyze exam performance across all your assessments. Monitor completion rates, pass rates, and identify areas for improvement.
- See total completions, pass counts, and pass rate for every exam
- Compare exam completion vs. pass results with bar charts
- View technology distribution across your exam catalog
- Sort and filter exams by average score, difficulty, and last activity
Detailed Analytics Features
Drill down into user and quiz performance with granular reporting
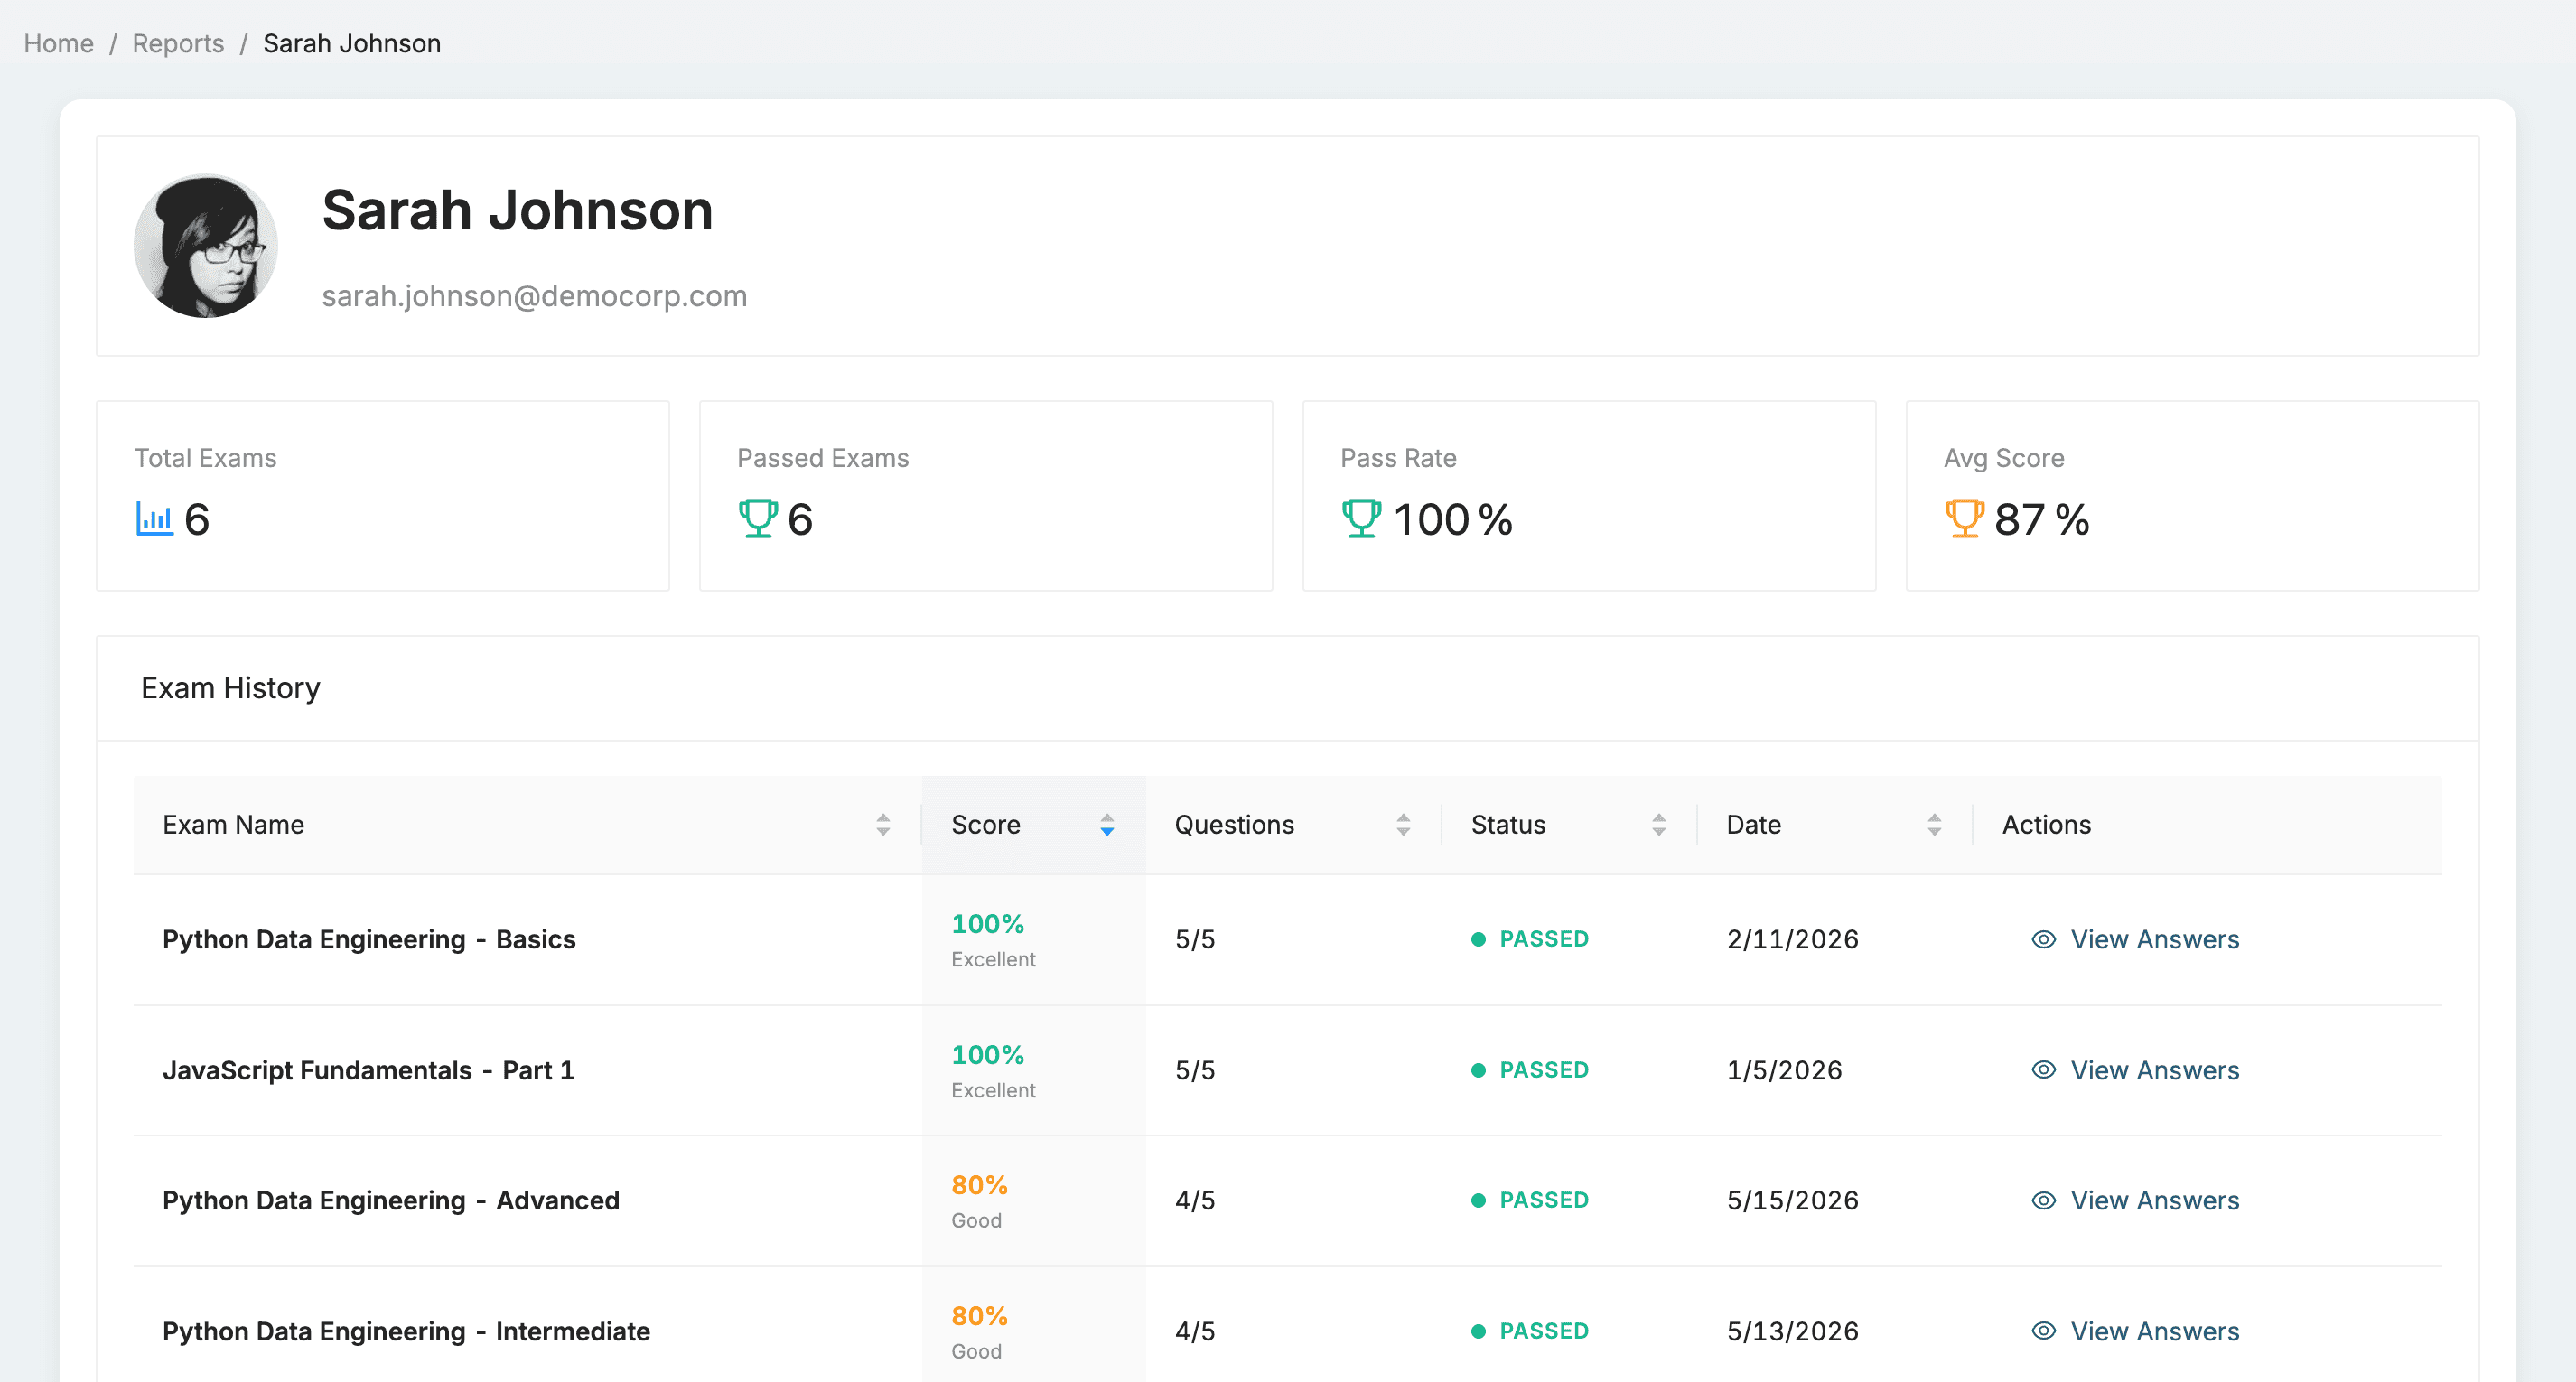
Individual User Metrics
View comprehensive performance data for each user. Access detailed exam history, pass rates, average scores, and progress tracking for individual team members.
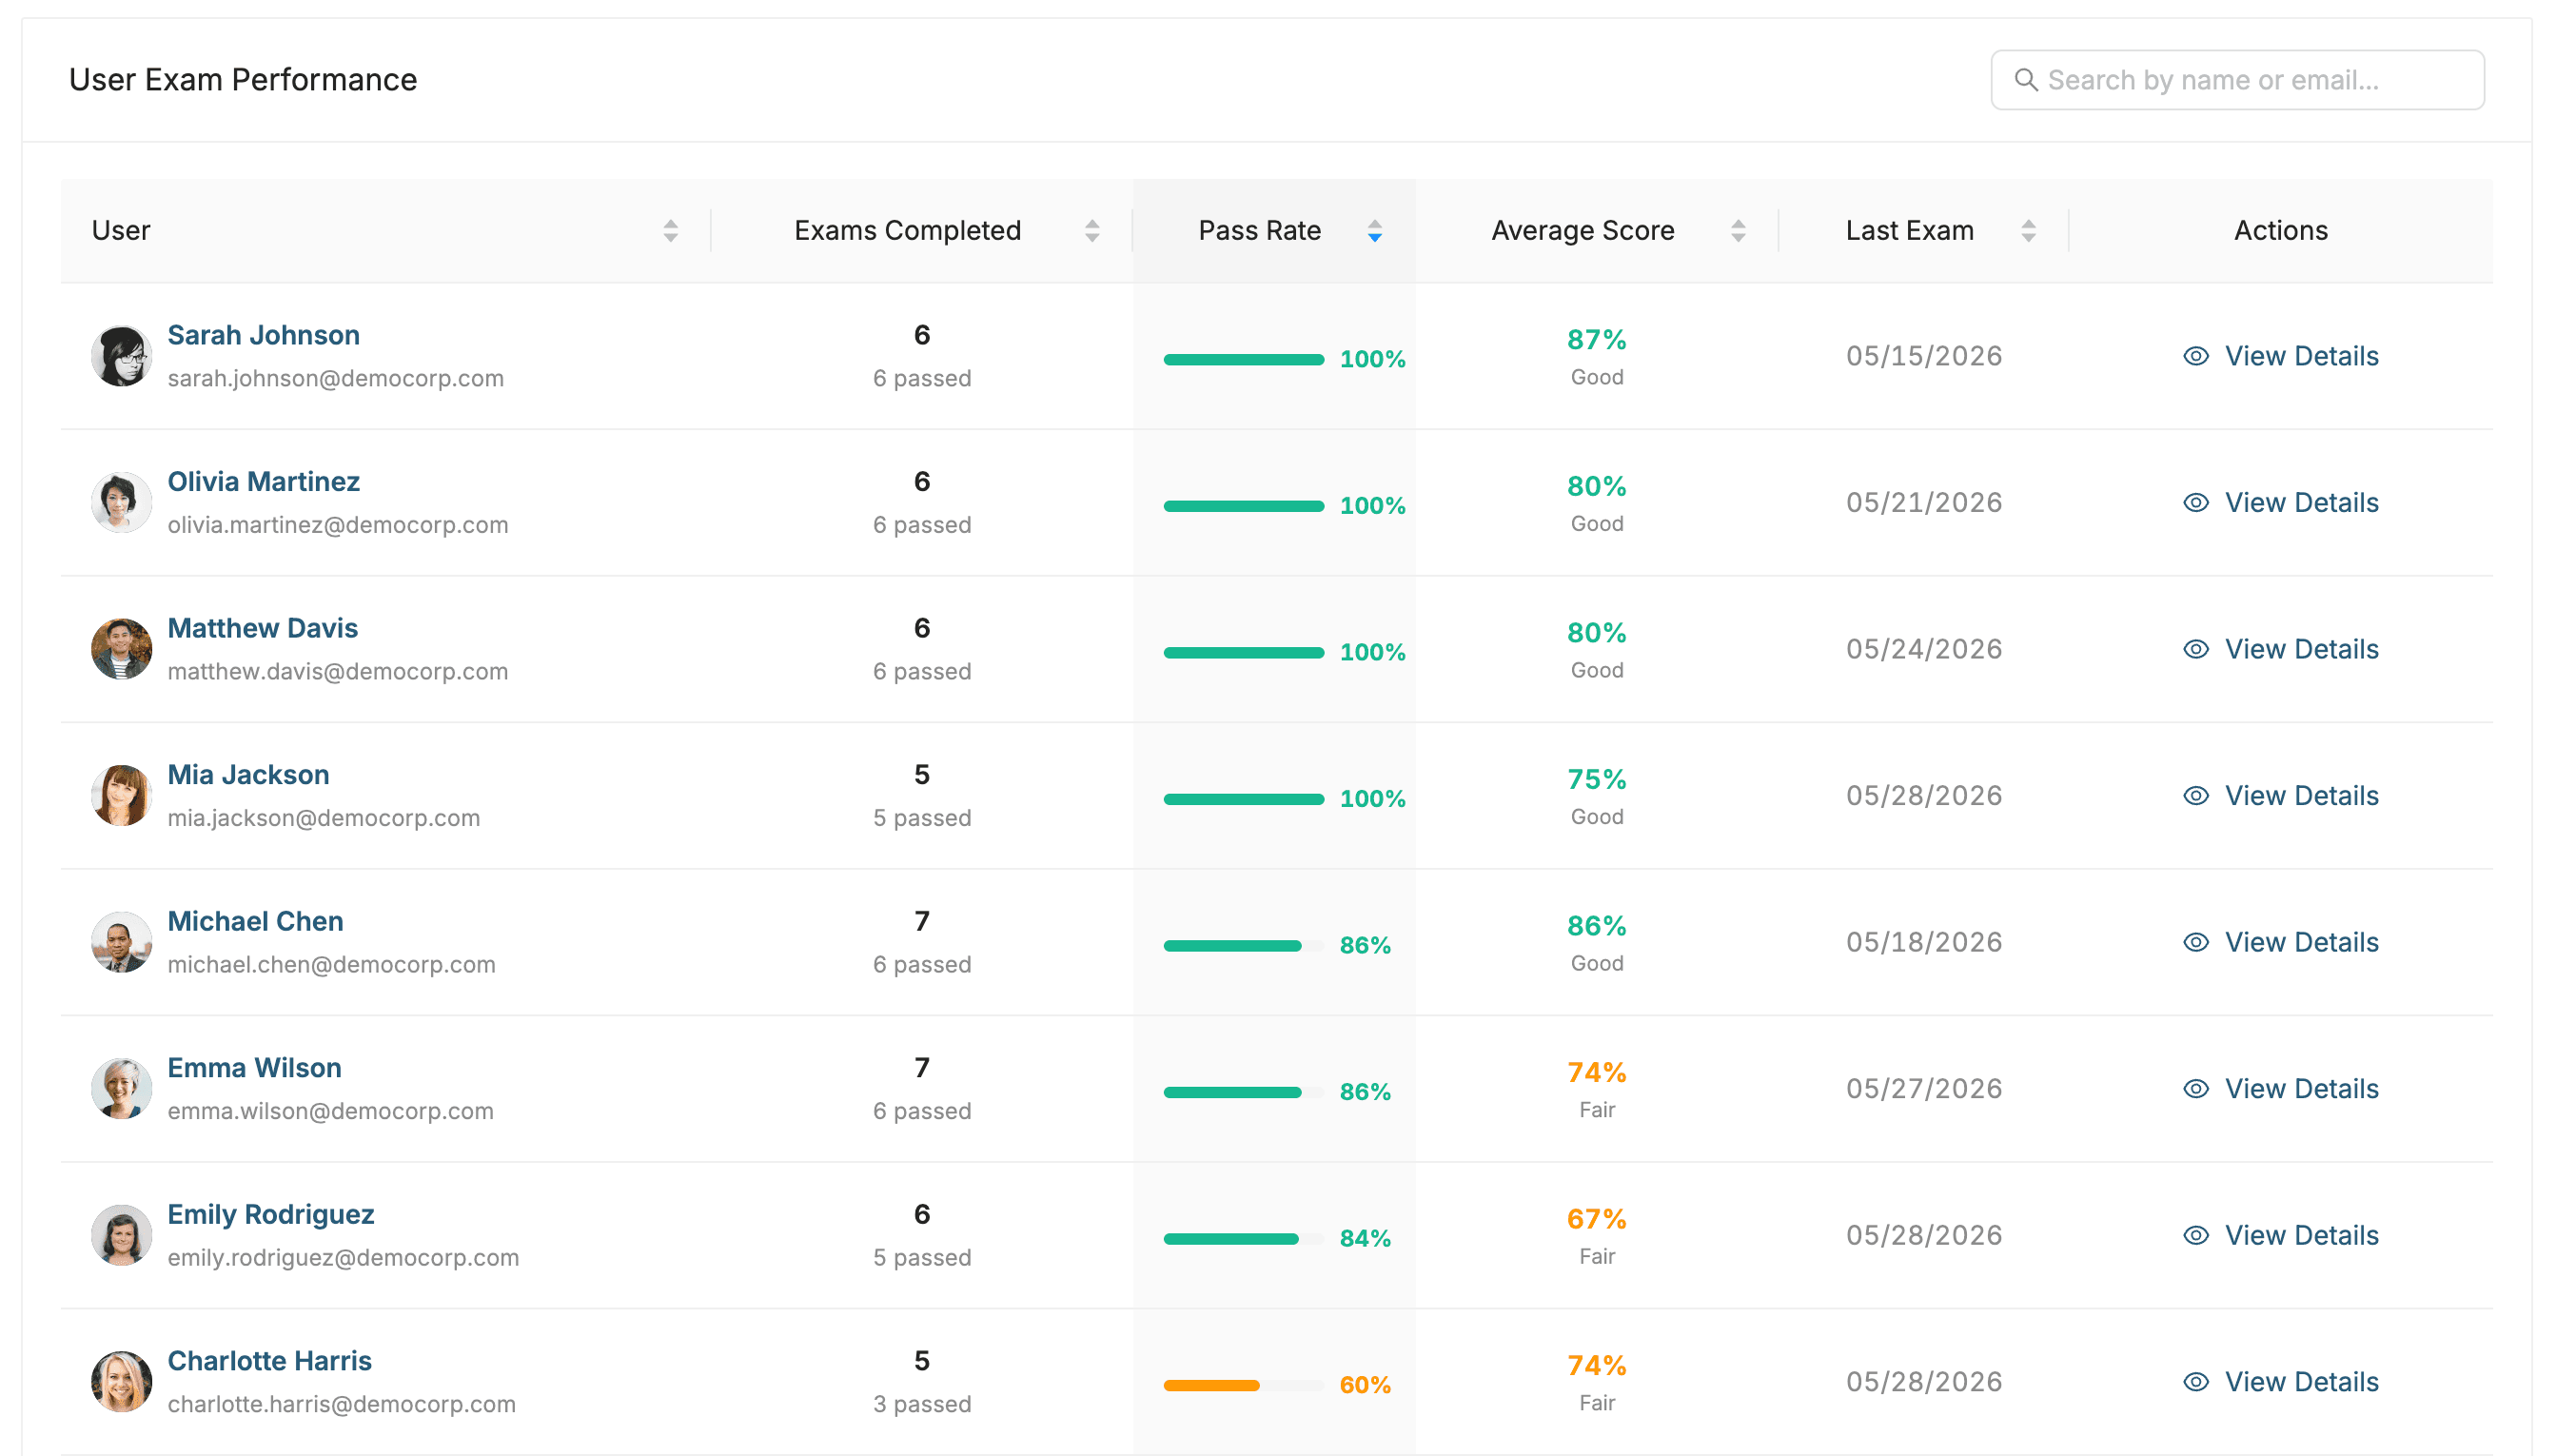
Top Performers & Activity Trends
See which team members lead in completed tests and average scores. Visualize user engagement with monthly activity trend charts to spot engagement patterns.
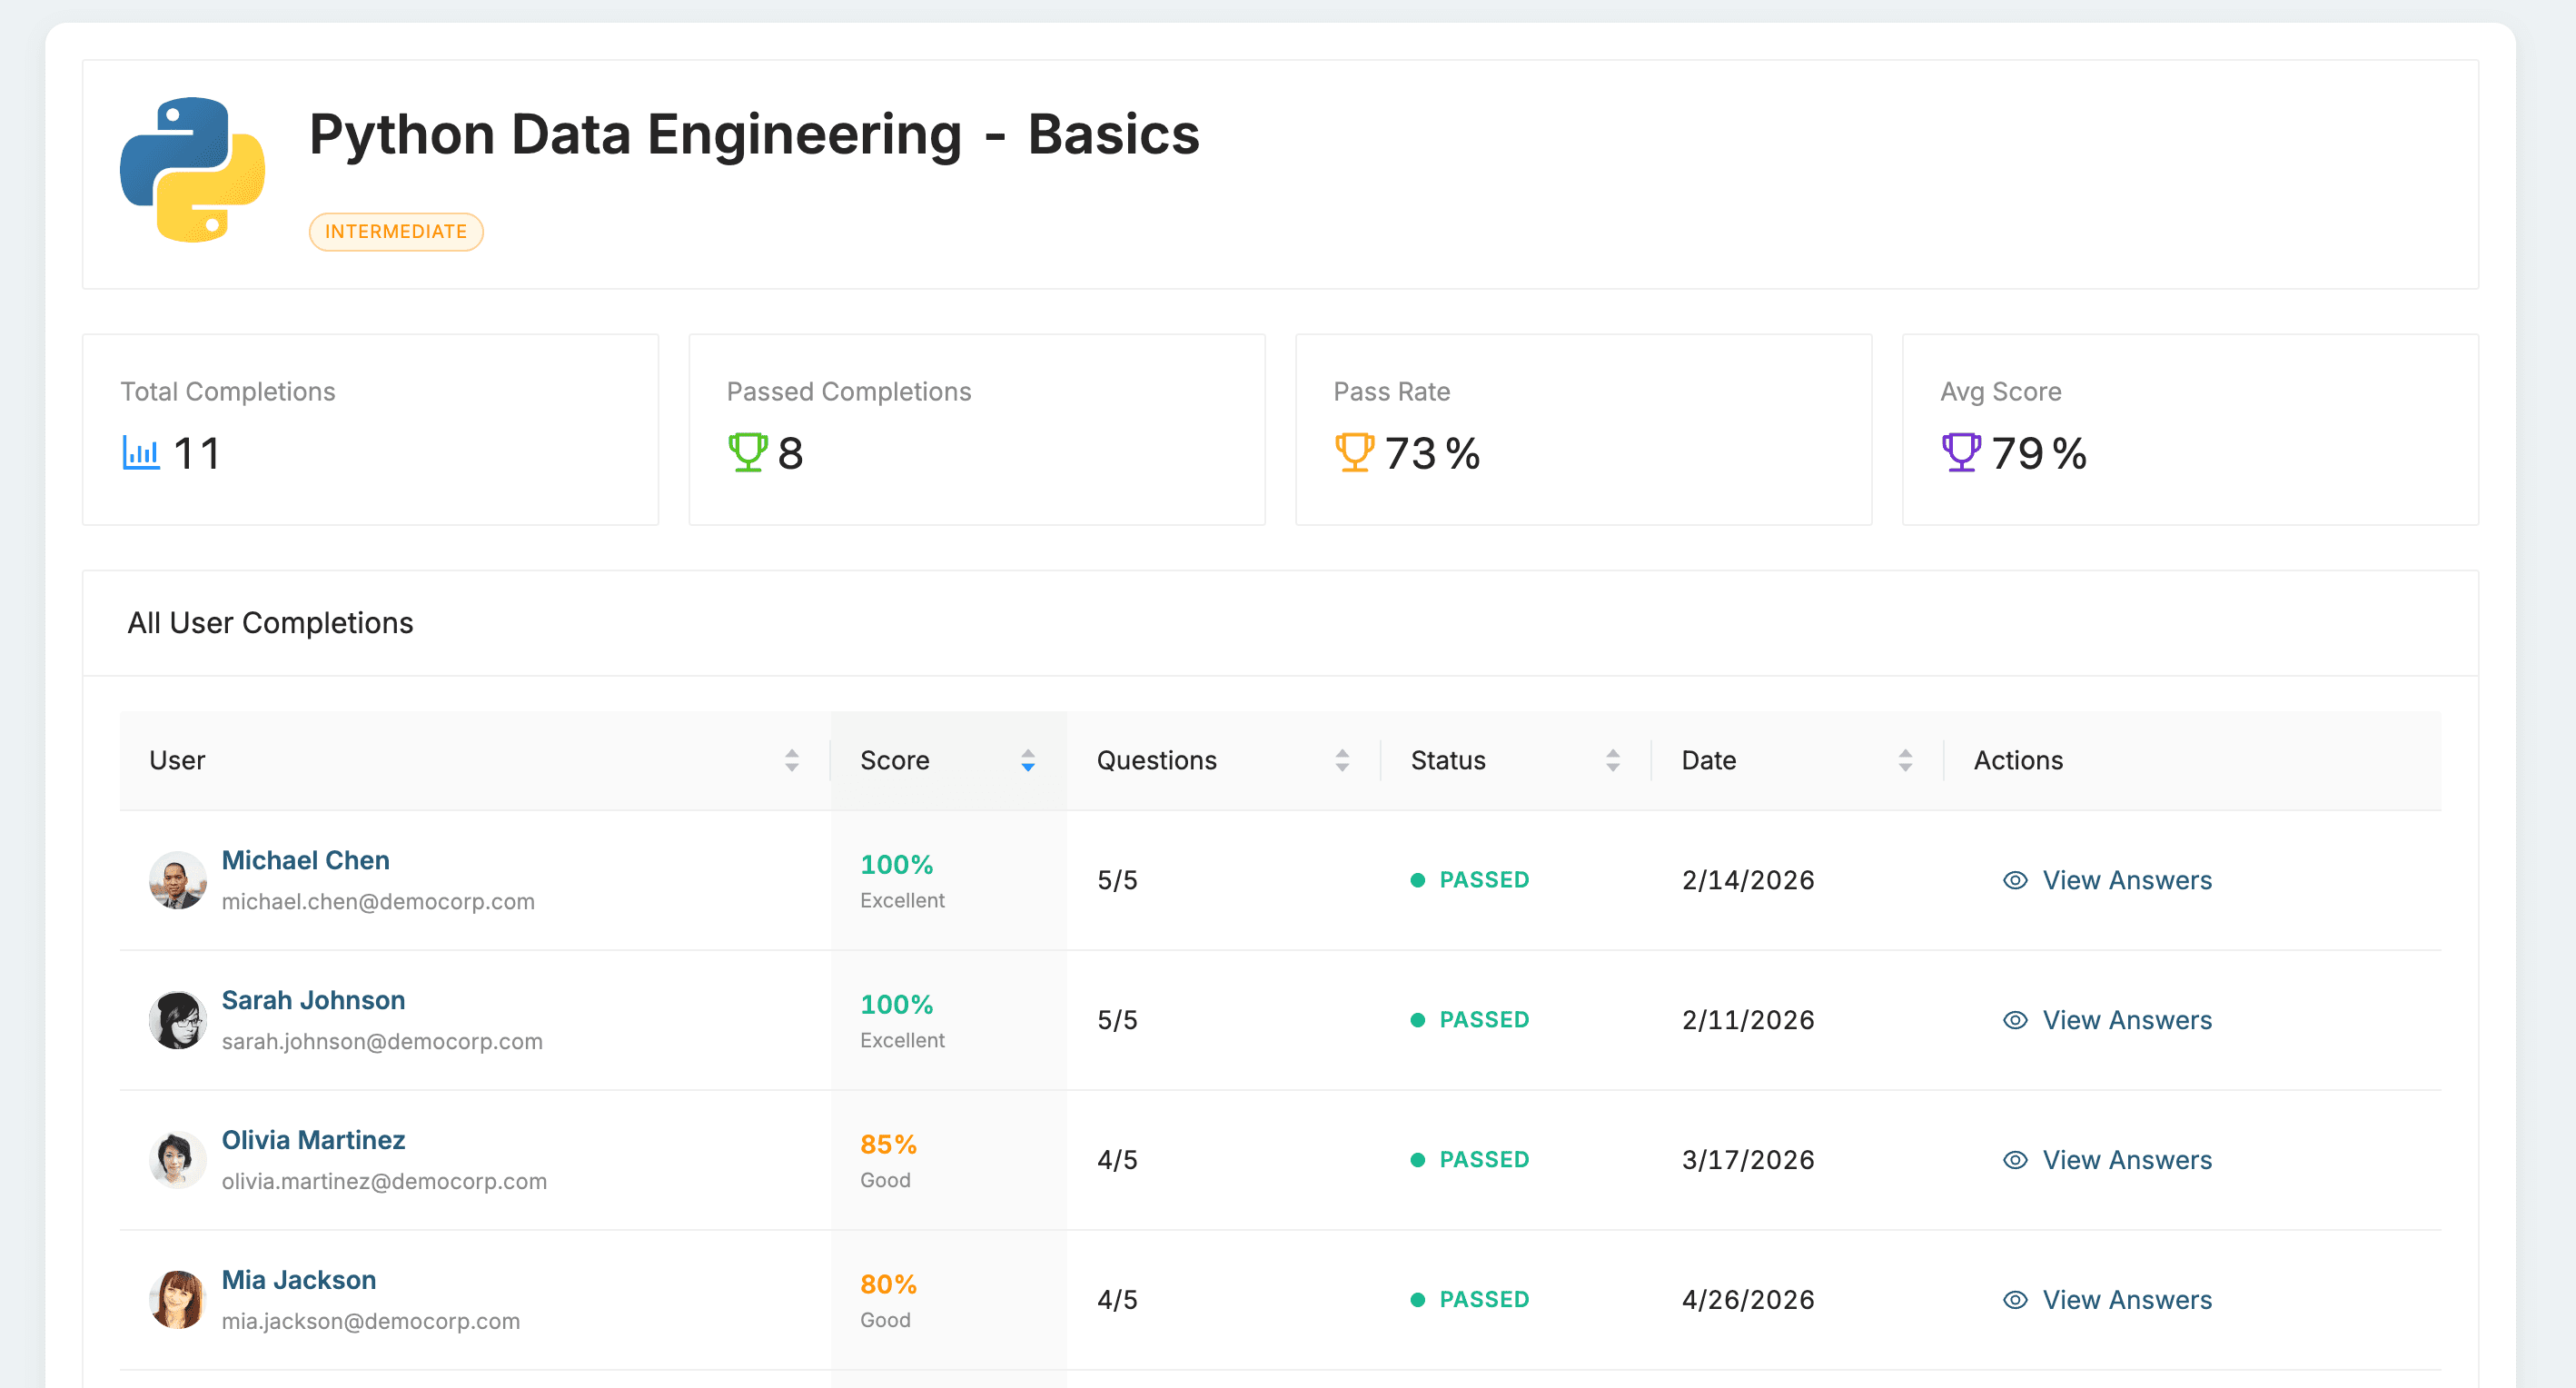
Exam Performance Analytics
See all users who have taken a specific exam. Compare pass rates, score distributions, and question-level difficulty across your entire exam catalog.
Start Making Data-Driven Decisions
Join thousands of organizations using FullCertified analytics
Get Started Free